
Monitoring Developments in EU Capital Flows in the Global Context
Trends and developments in cross-border investment are affected by regulatory, tax, trade, and investment policies as well as uncertainty and exogenous events. Barriers to the free movement of capital and uncertainty can deteriorate the degree and resilience of EU financial integration and hinder the functioning of the single market.
Every year, we offer an overview of the recent global developments and a detailed analysis of intra- and extra-EU capital movements assessing temporary changes and long-term trends is prepared. A special section is devoted to an in-depth analysis of EU inward FDI and the distinction between “phantom” and “real” investment.
The studies are accompanied data visualisation, available below.

The studies are prepared on request and with the financial support of the European Commission DG-FISMA
Visualisation developed by Mattia Di Salvo
EU Foreign Direct Investment
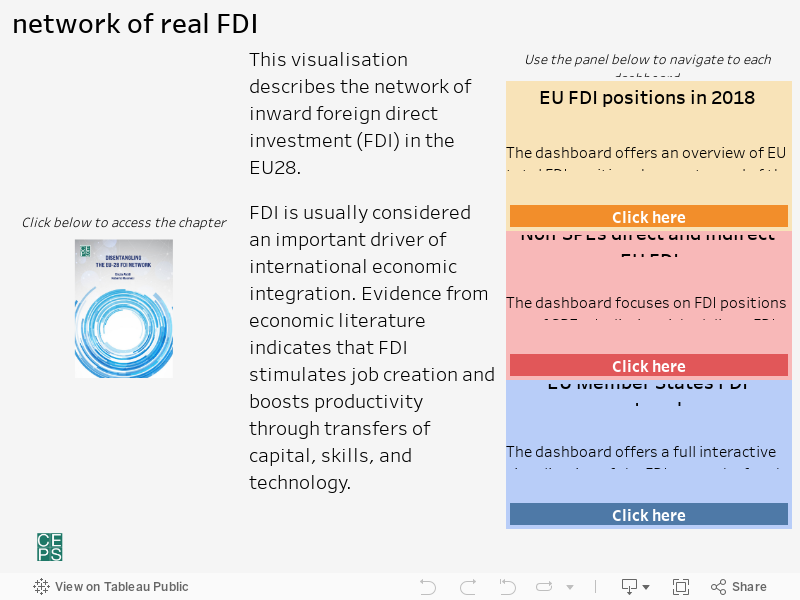
FDI can work as a powerful engine of the growth of the receiving economy. Yet, developments in recent years have resulted in flows that are likely to have little links to the local real economy. As result, the impact of FDI on the real economy can be largely overestimated. In order to address this issue, we attempt to disentangles EU member states FDI positions isolating FDI directed into Special Purpose Entities (SPEs). The latter usually have little real economy impact. They are often located in countries with favourable regulatory frameworks with the purpose of moving risk away from the parent company’s balance sheet. SPEs may also be used to provide increased confidentiality or could be utilised to take advantage of local tax systems. For EU-28 member states, excluding FDI into SPEs implies reducing the total EU FDI position by more than half, in 2018. For the remaining ‘real’ FDI, we distinguish the country of residence of the ultimate investor from the one the immediate investor. This allows us to identify the true FDI network of each EU member state, both within the EU and at global level.
A detailed description of the methodological approach and the analysis of the findings can be found in Chapter 5 of the 2020 Report as well as below, accompanied by an interactive visualization of the EU FDI network.
Visualisation developed by Roberto Musmeci
Disclaimer
The information and views set out in the studies are those of the authors and do not necessarily reflect the official opinion of the European Commission. The European Commission does not guarantee the accuracy of the data included in the studies and shown above.